Quarter 4 Market Update
Quarter 4 Market Update
US markets finished 2019 on a high note, in very different fashion from the prior year. On Wall Street there is an old saying that “the market climbs a wall of worry.” The wall was very tall this year, and climb it did.
In Q4, with the consummation of a Phase One trade deal with China nearly complete and more clarity on Brexit, sentiment started to lift. Capital started to flow into equities, sentiment surveys have become more elevated and our shorter-term indicators are showing the market reaching overbought levels. However, on a longer-term basis, there are many reasons to remain optimistic!
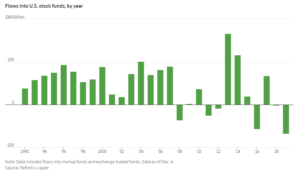
Equity Outflows a Very Positive Sign for the Next Year
2019 saw significant outflows from equity funds as shown below. Over the past 50 years, anytime a calendar year has shown outflows, the following year has been a flat to up year with a median return of 21.9%.
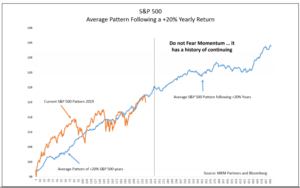
Momentum Tends to Continue
The below chart shows the average pattern of all occurrences in the post-war era where the S&P500 has returned over 20% in a year (like it did in 2019) and how it performs in the following year (which is the blue line from the point of the vertical line), which is very positive. 83% of occurrences show positive returns in the next year with an average return of ~12%.
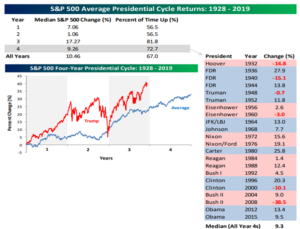
4th Year of the Presidential Cycle is Typically Positive
Since it’s the start of a new year, we also think it’s fun to touch on the average returns in each year of the presidential cycle. The third year, which we just finished, tends to be the best year. However, the 4th year is the second best with ~9% median returns and 72% of occurrences positive.
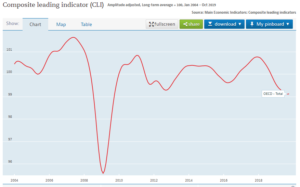
Economic Leading Indicators are Moving Back Up
Economic leading indicators (such as building permits, retail sales, inventory levels, manufacturing activity, etc.) has been deteriorating since the start of 2018 and have just started to turn back up. Going back to 1960, when the leading indicators turn up for the first time in over a year, the S&P500 has a median return of 15% with 85% of occurrences being positive.
These statistics are not bullet proof, they are only a glimpse at what has happened historically in similar situations. And it’s worth noting they are not as strong as we were seeing one or two quarters ago before the market had a big run. However, they are strong enough to keep us leaning bullish as we enter this new decade.
International and Emerging Markets
Over the last year or so we’ve touched on the substantial under-performance of international and emerging markets to US markets. However, those markets had been in down to sideways trends for the last few years. Both markets look like they have broken out of their consolidating trading patterns and are moving into new up-trends. Technical and momentum factors like this have taken on increased importance in recent years as the markets are dominated by computers using trend following techniques (what goes up tends to keep going up and vice-versa).
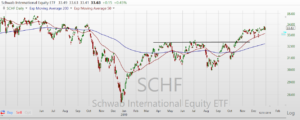
200-day and 50-day moving averages are moving up, broken out above prior highs
With President Trump likely moving to sign more trade deals before the election, as well as more clarity on Brexit, this new uptrend is confirmation that it is time to become more bullish on these asset classes. We will be gradually updating our asset allocation models to reflect a more overweight approach.
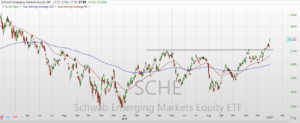
200-day and 50-day moving averages are moving up, broken out above prior highs
Conclusion
While not as short-term bullish as we were in our last letter, the statistics continue to point to positive results for the next twelve months in the equity markets. International and emerging markets are beginning to trend up, have reasonable valuations and a long way to go to catch up to US markets. As we head into election year, we will remain alert as certain sectors become punching bags for candidates but also expect the President to do what he can to fuel the economy and get re-elected.
Please feel free to reach out anytime with questions or to discuss any investments.
All the best,
Your Krozel Capital Management Team
Disclaimer: The views and opinions expressed in this quarterly letter are those of Krozel Capital LLC and Fortis Financial Group (“the firm”), which is a wholly owned subsidiary of Fortis Holdings LLC. Portions of this letter may contain certain statements relating to future results regarding companies we may invest in which are forward-looking statements. These statements are not historical facts, but instead represent only our belief regarding future events, many of which, by their nature, are inherently uncertain and outside of our control. Such forward-looking statements are made pursuant to the Safe Harbor Provisions of the Private Securities Litigation Reform Act of 1995.
Forward-looking statements are subject to market, operating and economic risks and uncertainties that may cause our actual results in future periods to be materially different from any future performance suggested herein. Factors that may cause such differences include, among others: increased competition, increased costs, changes in general market conditions, changes in industry trends, changes in the regulatory environment, changes in loan relationships or sources of financing, changes in management, and changes in information systems and technology.
The firm will not publicly update or correct any forward-looking statements to reflect events or circumstances that subsequently occur or of which we hereafter become aware.
This letter should not be considered an offering or solicitation to invest with the firm. Ideas and views expressed within are not recommendations to buy or sell any securities. Past performance is not necessarily representative of future results. The investment strategy of the firm is not designed to resemble returns generated by the S&P500 or any other index mentioned herein, and strategy volatility may be materially different from that of the indices.